By: Deepak Varshney and Marina Mats
While strict lockdowns have – for the most part – eased, the pandemic continues to disrupt businesses everywhere. Restaurants, travel, and theme parks have largely resumed operations, albeit at often reduced capacity. Sports are back, but the spectators are not. And schools are in session, although what that means varies wildly.
How does that uneven impact translate into incident experience? Here’s a look at current trends by line of coverage and by industry, based on the U.S. property and casualty incident data of more than 400 organizations across 20 industries.
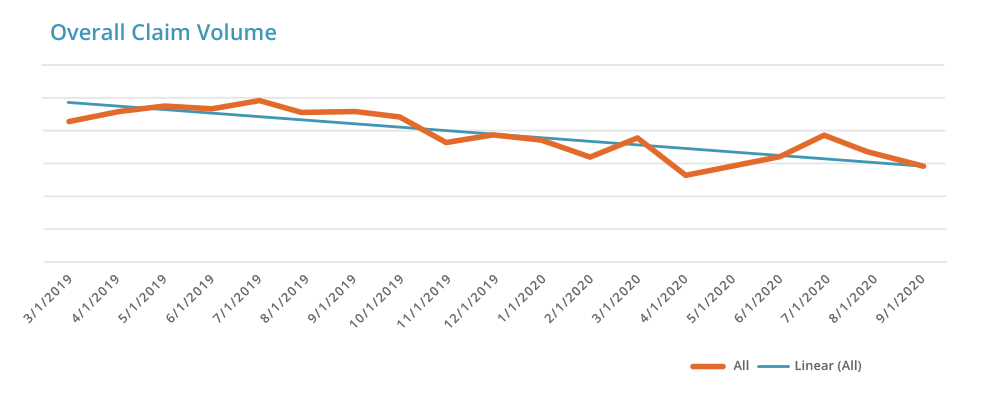
Overall Incident Volume
The overall number of incidents is down by 21% year-over-year. April had the lowest number of incidents – which is not surprising given that most of the country was under a pandemic-induced lockdown. Since then, the number of incidents has been rising steadily, increasing by 7% in September 2020.

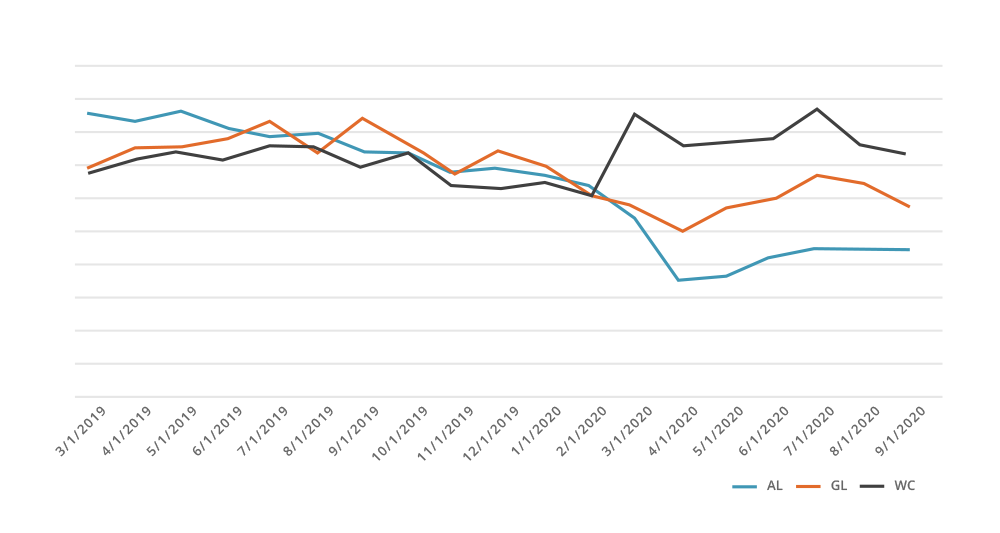
By Line of Coverage
General Liability. As many businesses reopened and people resumed shopping and visiting public places, the number of GL claims has increased since April. However, the climb is slow, as many are still cautious. Compared to September 2019, the overall number of GL claims dropped 32%.
Auto. Similarly, the number of AL incidents has increased since April 2020. More drivers on the road translated into 13% more incidents since April. However, the number of AL incidents dropped 40% since September 2019.
Workers’ Compensation. The number of WC incidents grew 5% when compared to September 2019. That said, the number of WC incidents is 4% lower than April 2020, even though many businesses reopened, and employees started to return to the workplace.
Claims Trend Watch by Line of Coverage


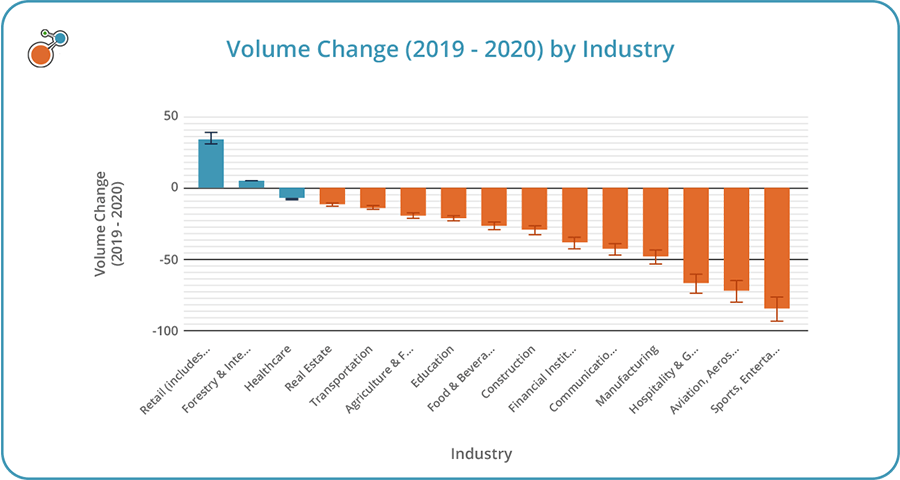
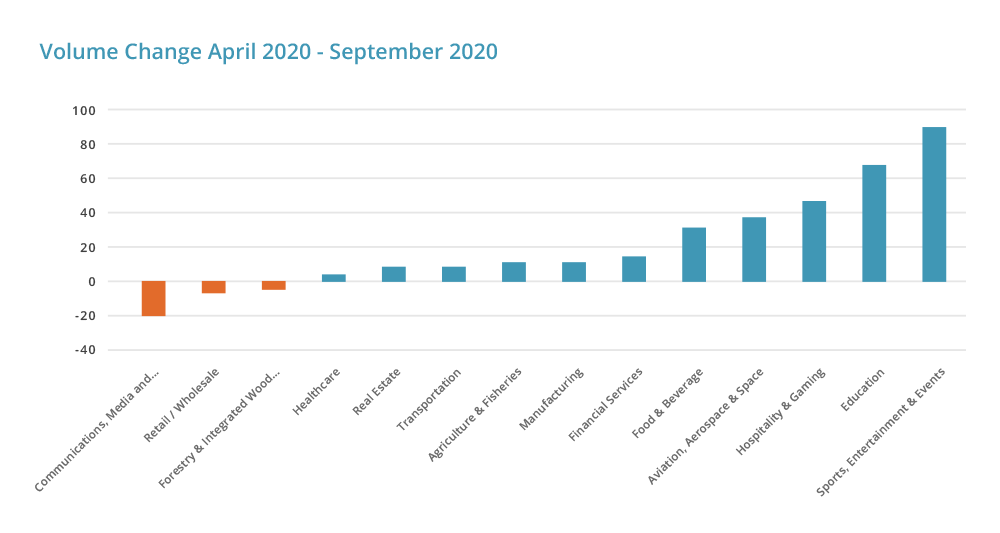
By Industry
Sports, Entertainment and Events. As sporting events resumed, the number of incidents increased a whopping 88% since April 2020 – the biggest jump of all industries. The number of incidents, however, remains a fraction of what it was a year ago.
Travel, Hospitality, Gaming, Food & Beverage. Theme parks, casinos, hotels, and restaurants reopened. With customers and employees on premises, the volume of incidents increased accordingly. The highest increase in incidents – 49% – was experienced by hospitality and gaming, followed by aviation and food & beverage, increasing 38% and 33%, respectively.
Education. Many students and educators returned to schools and colleges with partial in-person attendance, which caused the number of incidents to spike by 72% since April when most students were at home e-learning.
Retail, Wholesale, Pharmacy. At the other end of the spectrum is the retail, wholesale, and pharmacy industry. The number of incidents is finally starting to decrease, down 5% since April 2020.
Healthcare. Incidents in the healthcare industry dropped 4% from April to September. Even though healthcare facilities resumed elective surgeries, many people are still reluctant to move forward with planned procedures.
Claim Trends Watch by Industry


Check out our other Claims Trend Watch blogs here and here.
For more on managing claims effectively, download our e-book, Claim Success: How to Achieve Excellence in Claims Management.


